 There are a variety of key metrics and performance ratios that credit unions should familiarize themselves with when evaluating their yearly performance. By analyzing certain metrics like the efficiency ratio, loan originations per employee, loan to deposit ratios and the cost of technology per member (among others), CUs can get a better idea about how they are performing overall.
Comparing your credit union’s key growth indicators against your peers is an honest way to look at weaknesses and inefficiencies and find places where improvements can be made. It will also help identify strengths at the CU so that you can keep building on the things you’re doing well. During such turbulent and unprecedented times, credit unions who have a firm understanding of key performance ratios and can stay agile and adjust their strategies will have the advantage.
How to calculate ROA for CUs
Although there are many metrics that are vital to evaluate to understand your credit union’s performance, one of the most important metrics to analyze is Return on Assets (ROA). This metric, which is calculated by dividing a CU’s annualized net income by average total assets, is an important gauge of profitability because it reveals how much income is generated for each dollar of assets deployed.

In the past, CUs strived for an ROA rate of 1.5% or above. However, predictably so, 2020 saw significant declines from this benchmark. Determining your CU’s ROA can shed light on how efficiently your management team is using assets (mainly technology and people) to generate income for the credit union.
Benchmarking and remembering your CU’s strategy
Benchmarking against other CUs can help your CU identify opportunities, track internal goals, and get a better understanding of the market. It’s also important to realize how different strategies can affect your ROA, so knowing how to interpret the data is essential. Let’s have a closer look.
In general, a high ROA relative to your peers reflects management’s ability to utilize its assets to generate income. However, sometimes the ROA metric can be deceiving. For example, CUs that seek to maximize profit at the expense of their members could have a better ROA on paper, but their members aren’t benefiting. On the other hand, CUs that give higher deposit rates and low lending rates to members might have a lower ROA in relation to their peers, but they could still be successfully fulfilling the mission of their CU. That’s why it’s important for CUs to consider their ROA in relation to their goals and mission, and to have a cohesive and unified strategy.
How to evaluate your ROA
The economic uncertainty brought on by the pandemic had a huge effect on businesses around the world, including credit unions. Restrictions on business openings and fear of the virus spreading changed consumer behavior in unforeseen ways, giving rise to a surge in e-commerce, online banking, and other digital solutions like core software technologies. It also had a huge effect on CU’s average ROA.
The following chart is helpful to understanding the changes that took place in 2020:
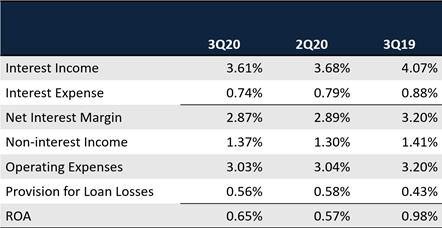 *Source Callahan & Associates | www.creditunions.com
A variety of factors affected CU’s ROA in 2020. To begin, economic relief packages and changes in federal monetary policy caused credit unions to take a more prudent approach towards risk management, and rightfully so. In the first quarter of 2020, provision expenses also rose, and ROA basis dropped by 41 basis points. Then in the second quarter, after the Fed cut interest rates in March, credit unions braced for widespread credit deterioration, slowing consumer loan demand and a decline in investment yields. These factors contributed to a drop in ROA across the board.
But summer brought signs of hope for CUs. Most notably, the easing up on restrictions around the country caused consumer spending to return and non-interest income and member spending began to slowly increase. Although ROA dropped 32 basis points in the 3rd quarter of 2020, between March and September the national average ROA increased by 14 basis points. While the future remains uncertain, credit unions and their executives are optimistic about 2021.
For credit unions having trouble meeting their goals, one way to significantly improve efficiency is through the right core system software. Efficient credit union core system technologies can enhance member-consumer relations and help CUs improve key growth metrics. To get through another tough year, CUs must make the most out of their staff and technologies to benefit their members.
Download the white paper to learn more about seven key credit union ratios to consider for core system efficiency.