The Top 5 Dashboard Reports for Credit Union CEOs
 Credit union CEOs have to constantly oversee policy, staff, budgets, operations, planning and reporting. In a single day, they have their hands on many different projects and high-level decisions. Anything that can give CEOs an 'at-a-glance' view of the credit unions status is not only valuable to the individual but to the entire credit union. Reporting and analytics are essential information to credit union executives, but an easy dashboard reporting solution is even more important for efficiency and a high-level view of credit union operations. Here are the top five credit union dashboard reports CEOs find most beneficial.
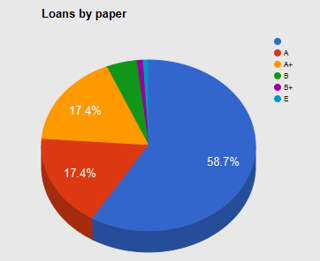
1. Loans by Paper Grade
This report breaks down the entire loan portfolio by credit grade. This dashboard can give a great view to the health of your CU's lending. knowing the advantages of higher interest rates weighed against the risks of a large number of lower grade loans can give the CEO a view of the stability of the credit unions loans.

2. RDC Deposits (month to date)
This dashboard report shows the number of remote deposits made and uses a simple bar graph to display the data. As mobile banking becomes more and more important, this dashboard helps CEOs understand their audience and if they're using the credit union's remote deposit capture service. When it comes to managing or developing a strategy to increase mobile banking app downloads and use, it's important to know when and where your members are using your resources. (Read our article: 5 Fast Actions to Increase Mobile Banking App Downloads)
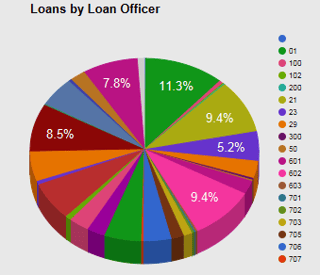
3. Loans by Loan Officer
A pie chart that displays how many loans as well as the total dollar amount each loan officer has processed. This information is important to keep track of standouts or employees going above and beyond. It is also a great way to gauge loan officers success and reward those who are meeting or exceeding benchmarks. On the reverse, it also can indicate where an employee needs additional coaching or training.

4. Loans by Branch
Another pie chart that displays the number of loans each branch is producing. Useful to CEOs who oversee multiple branches, this dashboard helps determine which branches are succeeding or failing to meet the lending needs of their members. Problems can be detected earlier with this branch specification tool instead of grouping them all together.
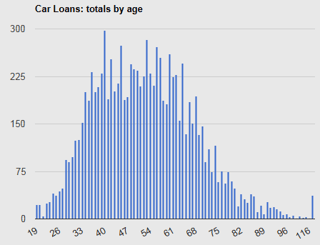
5. Auto Loans by Age
This is a line chart that breaks down the auto loan portfolio by member's age. Understanding your demographic is vital to a credit union's success. With this dashboard, CEOs can determine which services to offer and how to reach their audience better. Millennials respond much differently than baby boomers so it's important to know who exactly is using your credit union services and how.

6. Transactions by Branch
Much like the loans by branch, this pie chart can provide insight into a branch that is losing or gaining foot traffic and is essential to monitor for strategic planning and resource allocation.
Do you have reports or dashboards you like best or find most useful? Keep the conversation going and share with us in the comments!
Also, download our operations eGuide and see what other efficiencies you might be missing out on.


