 Many credit union executives use their bottom line profitability as the primary measure of their success. Other credit union boards solely focus on the financial performance of a given quarter or year as it compares against the prior term's figures. By putting the focus of your CU's success on past results, you lose the advantage of being a forward thinker; You ignore how well your key performance indicators (KPI's) measure against the results of credit unions in your asset group. Approaching your performance measurement this way is known as “benchmarking”.
Benchmarking: a measurement of the quality of an organization’s policies, products, programs, strategies, etc., and their comparison with standard measurements, or similar measurements of its peers.
Earlier this year, we investigated how credit union efficiency ratio compares to other credit unions in your state in our article: Average Credit Union Efficiency Ratio per State: How Do You Stack Up? The NCUA also releases a benchmarking report with a summary of trends by credit unions broken down by asset group. With any benchmarking strategy, the first step is to identify what relevant key financial and operational data should be used to measure your own internal past performance as well as against the industry average and industry leaders. How your figures compare to your own previous performance might make the need to improve obvious. But when comparing figures to your peers, you gain insight into how the market is impacting your peer group.
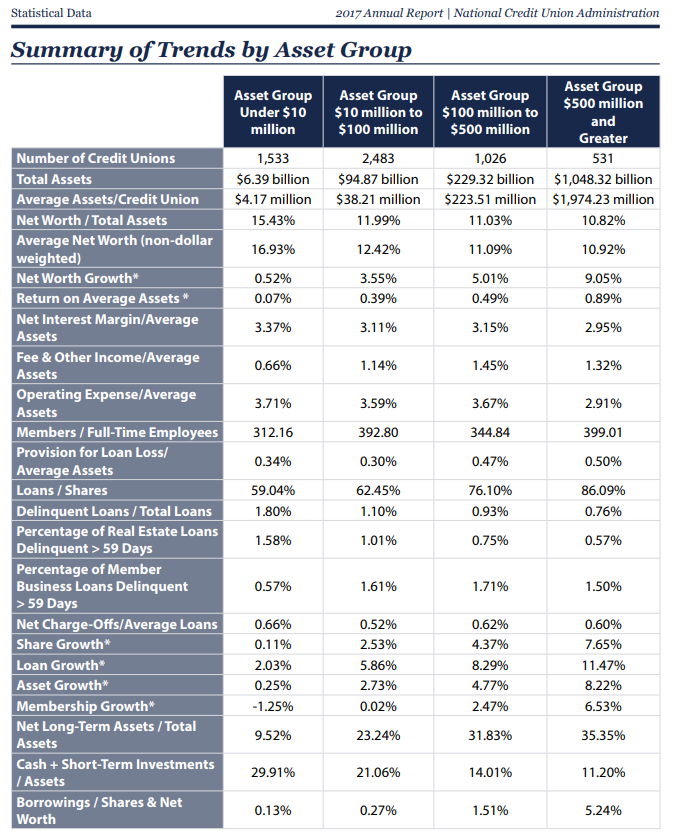
The NCUA identified 20+ relevant financial data points, including efficiency ratios that CU's can use to benchmark their KPI's against their peer's. Here is a summary of just a few of their findings as reported in March 2018's NCUA 2017 Credit Union System Performance Data:
- Asset Size: Less than $10M
Number: Declined to 1,533 in 2017 from 1,659 in 2016.
Percentage of Assets: Held less than 1 percent of all CU assets with $6.4 billion aggregate assets.
Loans: Declined 5.5 percent.
Membership: Declined 8.8 percent.
Net worth: Declined 5.0 percent. - Asset Size: $10M-$50M
Number: Declined to 1,774 in 2017 from 1,851 in 2016.
Percentage of Assets: Held 3 percent of all CU assets ($44.2 billion).
Loans: Declined 0.9 percent.
Membership: Declined 5.8 percent.
Net worth: Declined 2.8 percent. - Asset Size: $50M-$100M
Number: Fell to 709 in 2017 from 724 in 2016.
Percentage of Assets: Held 4 percent of all CU assets ($50.6 billion)
Loans: Declined 0.1 percent.
Membership: Declined 4.3 percent.
Net worth: Declined 0.7 percent. - Asset Size: $100M-$500M
Number: Declined to 1,026 in 2017 from 1,050 in 2016.
Percentage of Assets: Held 17 percent of all CU assets ($229.3 billion)
Loans: Growth of 1.0 percent.
Membership: Declined 3.8 percent.
Net worth: Declined 0.9 percent. - Asset Size: $500M-$1B
Number: Increased to 244 in 2017 from 229 in 2016.
Percentage of Assets: Held 13 percent of all CU assets ($172.7 billion)
Loans: Growth of 10.1 percent.
Membership: Increased 6.3 percent.
Net worth: Increased 6.4 percent. - Asset Size: $1B+
Number: Increased to 287 in 2017 from 272 in 2016.
Percentage of Assets: Held 64 percent of all CU assets ($875.6 billion)
Loans: Growth of 13.7 percent.
Membership: Increased 9.0 percent.
Net worth: Increased 11.4 percent.
How does your credit union stack up?
Benchmarking provides the baseline measurement that can guide your credit union's strategic planning. For example, did your credit union's loan portfolio experience a greater decline than the average for other credit unions of a similar asset size? What factors contributed to this? By benchmarking your numbers against the average you can see areas of weakness that are not in line with credit union industry trends. Management can then ask the tough questions as to why you are lagging behind and research can be done to see what other credit unions are doing that you are not to correct your course.

Below is the complete list of other benchmark data from the NCUA report that may be useful as you reset your 2018 goals now that we are nearing the halfway mark.